Case Studies
Barking Creek at A13 Frogmore
Grid Reference TQ4441183063
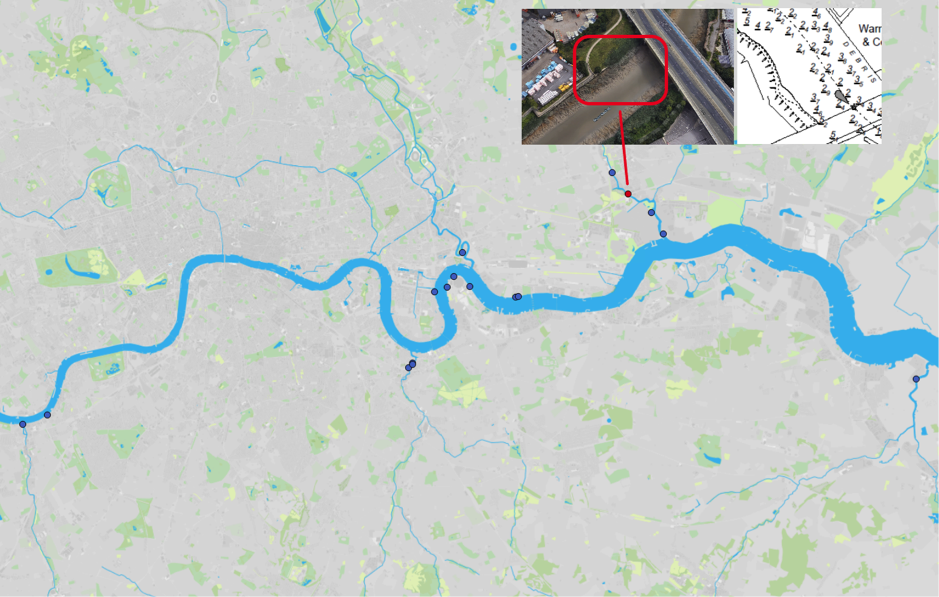
Figure 1: Map of Estuary edges sites pinpointing Barking Creek at A13 Frogmore; inset graphics include Google Earth aerial photo of site and chart extract of Site (heights in metres relative to Chart Datum).
1. Introduction
1.1 Site Conditions Summary
| Salinity (during low fluvial flows) | ~9‰ at creek mouth (open estuary) (Wade, Hawes and Mulder, 2017) |
| Date of construction | 2006 |
| Tidal Range | 1.6m |
| Percentage of area accreted above design level | 100 % |
| Degree of exposure to waves: | Low |
| Degree of exposure to currents: | Medium (including fluvial) |
| Max wave height | |
| Slope direction | West-South-West |
| Slope angle | 1 in 7 normal to flow (1 in 3 front face of new backing embankment), 1 in 58 parallel to flow. |
| Average Whole Structure lifespan | < 20 years |
Table 1: Site conditions summary.
1.2 Site Characteristics
- Located approximately 2.5km upstream of the mouth of the tidal River Roding (also known as Barking Creek) at a location known as Frogmore due to the name on the adjacent industrial unit.
- Left bank of the creek, extending from under the A13 road bridge to approximately 55m upstream (approximately 70m long in total).
- The creek is over 50m wide here with a 1.6m tidal range. Despite this width, the angle of the channel means that there is limited fetch for the prevailing south-south-westerly wind to create wind waves.
- Although around 1/3rd of the River Roding flows through urban north east London, the middle and upper catchment is rural. It is therefore not as ‘flashy’ as some of the south London rivers which are predominately urban. However, fluvial currents are still likely to medium due to the size of this river.
- Inside of a meander bend where currents will be slower.
- The salinity of 9‰ at the mouth of Barking Creek but will be lower here (may be by 2%) here due to the fluvial influence.
1.3 What the developers did
- Surrounding bridge walls, etc. provided a second line of flood defence and meant that the existing fronting concrete could be removed. This was broken out and/or truncated and capped with concrete.
- Slopes were re-graded and capped with clay and a fascine revetment installed.
- A coir erosion control blanket was installed over the upper slope to prevent sediment loss for up to 2 years during plant establishment. This was covered with ‘blinding layer’ of soil and seeded with wildflower mix. Additional saltmarsh seed was added in the zone between mean high neap and spring tides levels.
- Pre-planting was conducted: Cell-grown Common Reed was planted on the lower slopes.
- Biodegradable Hazel/brushwood fascines were placed in rows 1m apart to promote sedimentation at low- to mid-tidal levels.
- Rock rolls were placed in trenches to anchor the fascine rows at each end, but the revetment is still essential natural.
- Kingfisher burrows installed in the truncated concrete river wall.
2. Aerial photo and as-built drawings: plan view and cross-sectional view
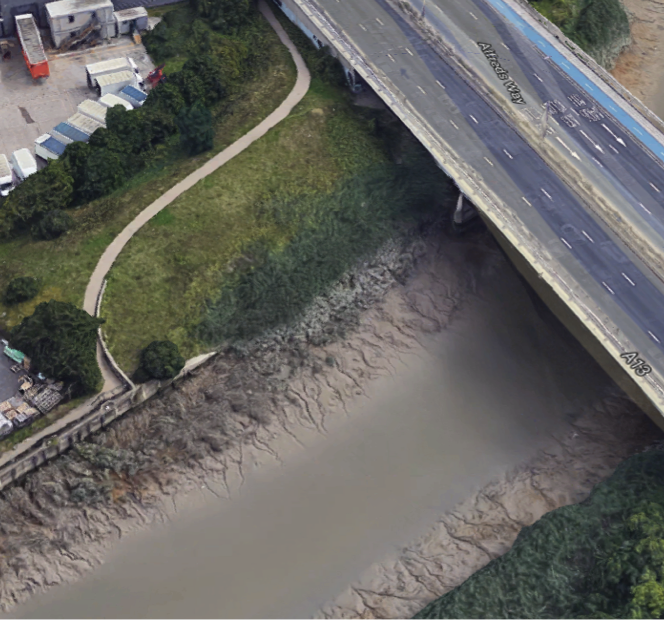
Figure 2: Aerial view of site (Google 3D image from 2018).
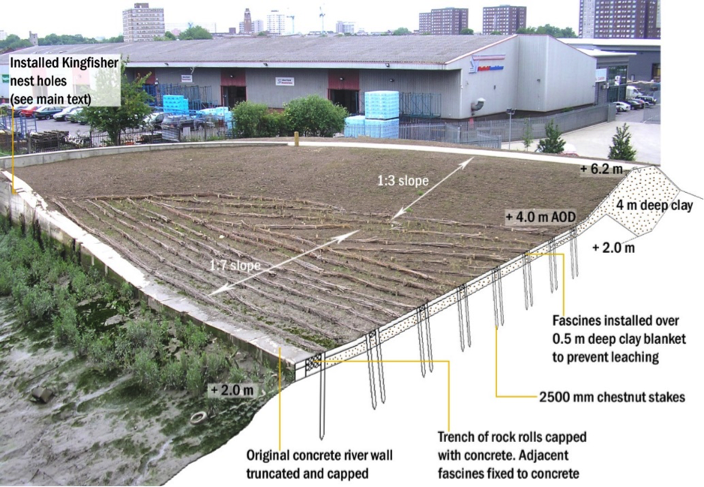
Figure 3: Barking Creek at A13 Frogmore: Artist’s impression combining ecology and engineering using a photograph from 2006 (just after implementation). Source: Estuary Edges 2008 document.
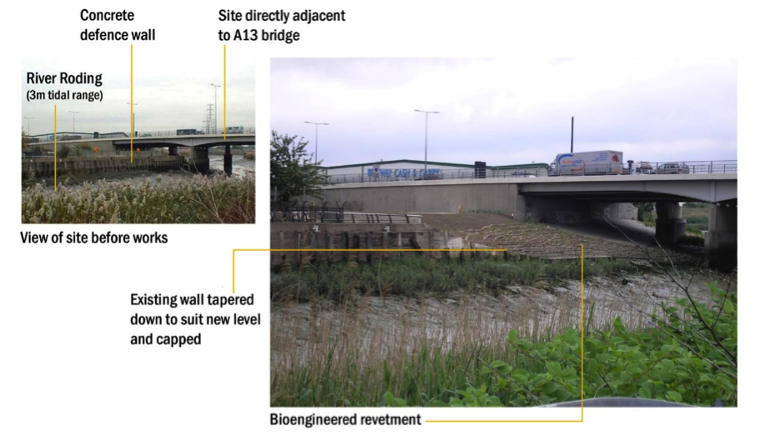
Figure 4: Barking Creek at A13 Frogmore: Immediately before and after implementation in 2006. Source: Estuary Edges 2008 document.

Figure 5: Barking Creek at A13 Frogmore showing detail of fascines in 2006 (just after installation). Source: Estuary Edges 2008 document.
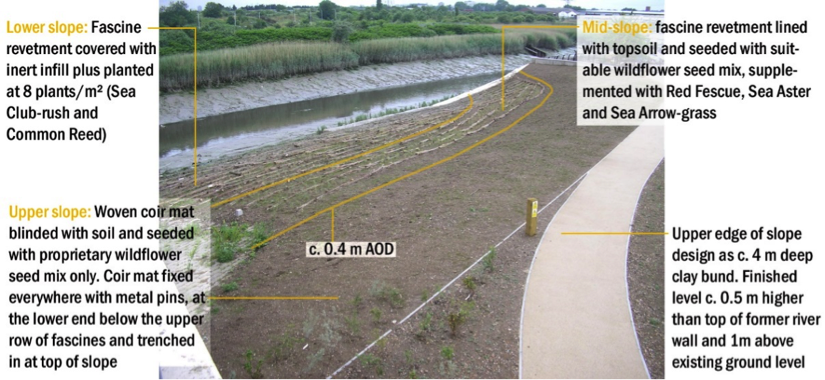
Figure 6: Barking Creek at A13 Frogmore showing different planting proposals and surface treatments in 2006 (just after installation). Source: Estuary Edges 2008 document. Section and plan view as built drawings unavailable for this site.
3. Environmental
3.1 Inundation
The immediate area of river in front of the terraces is shallow silt and mud, with a relatively steep slope to the centre of the channel.
The lower part of the slope is always covered with some water. During larger tides (spring) the terrace has water on it for five and a half hours. During smaller (neap) tides the terrace is only reached for almost five hours.
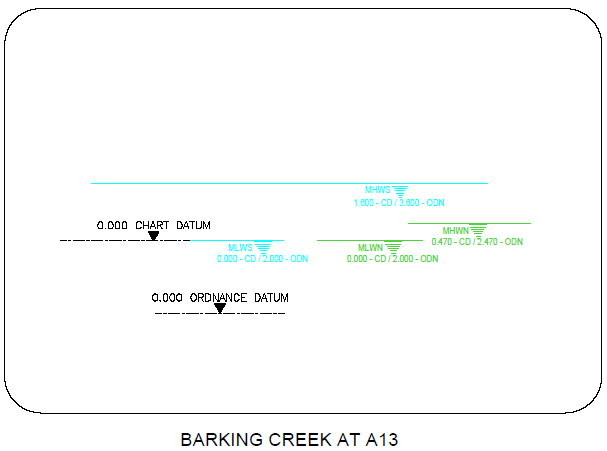
Figure 7: cross section of elevation of constructions (heights in CD)
3.2 Biodiversity
Adjacent Site:
The next nearest site where biodiversity surveys were conducted was Barking Creek, Beckton Sewage Treatment works which is also a naturalised setback (albeit with space for a proper creek), 1.2 km down the Roding/Barking Creek.
Fish:
Fish weren’t measured at the site. See Barking Creek, Beckton Sewage Treatment Works for a comparable site where they were measured.
Botany:
Flora wasn’t measured at the site. See Barking Creek, Beckton Sewage Treatment Works for a comparable site where it was measured.
Invertebrates:
Invertebrates weren’t measured at the site. See Barking Creek, Beckton Sewage Treatment Works for a comparable site where they were measured.
3.2 Geomorphology
100% of the accretable area has accreted with sediment above the design level (Figure 8). Deep drainage gullies (Figure 8), which could be a sign of erosion (but are generally good for biodiversity) are located outside of the footprint of the original feature.
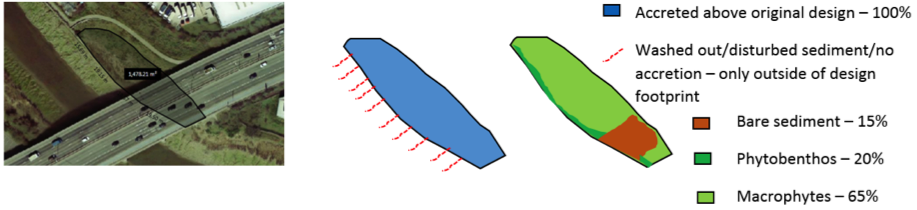
Figure 8: Schematic showing geomorphology and basic ecology.
Contributing reasons for this include:
- No wind waves.
- Little vessel traffic (no wake).
- Upstream end set back behind orginal concrete retaining wall thereby protecting from currents.
- Inside of meander bend (If meander bend was reversed it is likely that the downstream bridge abutment would promote scour to the feature) (Figure 9).
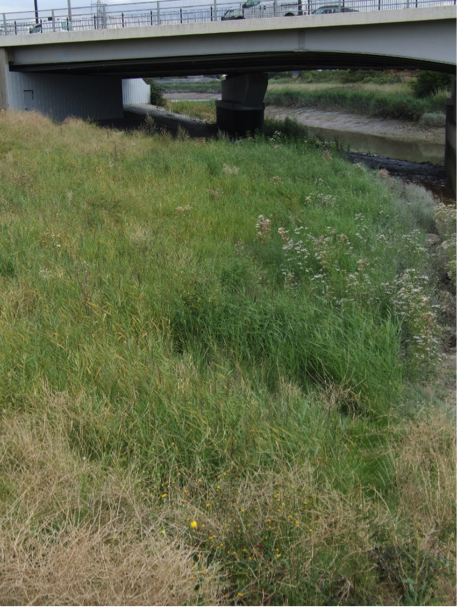
Figure 9: Barking Creek at A13 Frogmore, looking south east, showing vegetation establishment in 2007, just over 1 year after implementation. Source: Estuary Edges 2008 document.
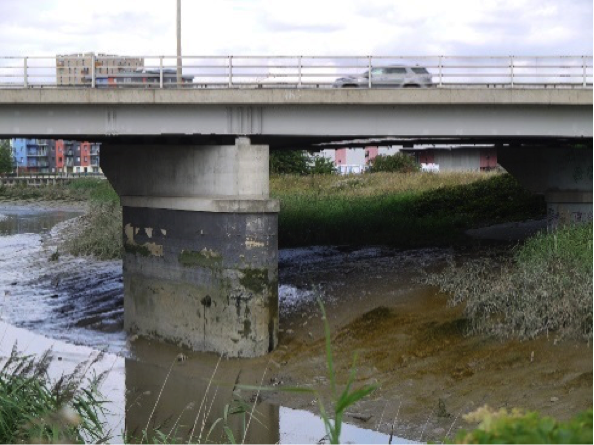
Figure 10: Barking Creek at A13 Frogmore, looking north in Summer 2017 (11 years after implementation), showing bridge abutment which would cause scour if the meander were not oriented in this direction. Source: Environment Agency.
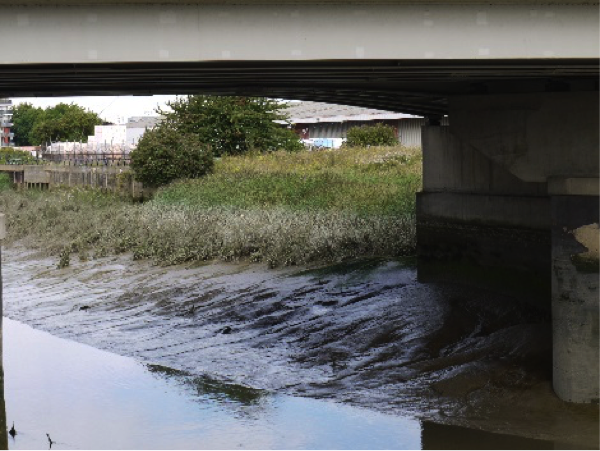
Figure 11: Barking Creek at A13 Frogmore, looking north in Summer 2017 (11 years after implementation), showing well established reeds beyond bridge abutment. Source: Environment Agency.
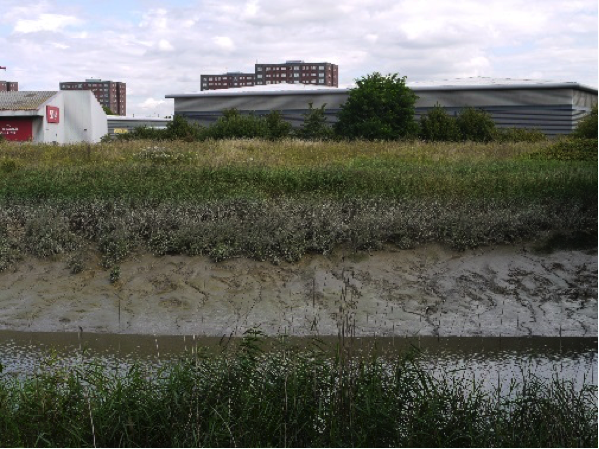
Figure 12: Barking Creek at A13 Frogmore, looking north-east in Summer 2017 (11 years after implementation), showing drainage gullies within the mudflat in front of the feature. Source: Environment Agency.
4. Social, Litter, Safety and Navigation
4.1 Social
The site is not easily publicly accessible and therefore no social surveys were completed as part of this review.
4.2 Litter
A few pieces of litter observed but the feature was generally clear (Figure 13).
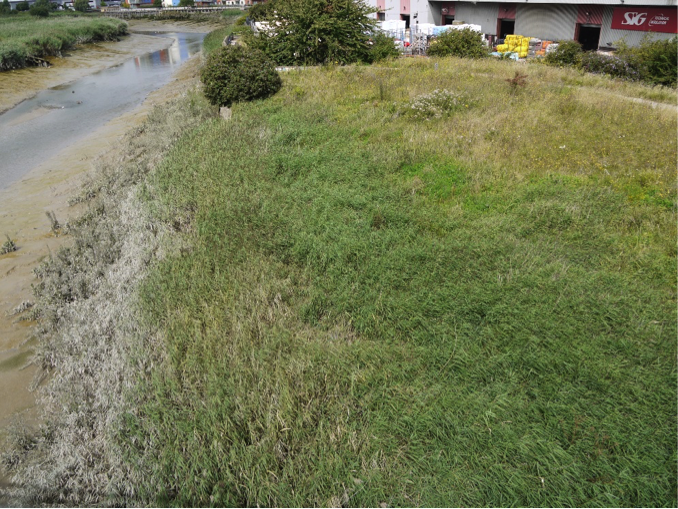
Figure 13: Barking Creek at A13 Frogmore, looking north from the A13 road bridge in Summer 2017 (11 years after implementation), showing little no litter collection. Source: Environment Agency.
Contributing reasons for this:
- No wind waves.
- Little vessel traffic (no wake).
4.3 Safety and Navigation
The proximity of the edge of the habitat creation and the navigational channel could the impact capacity maintain the channel for navigational safety in future. This should be further towards the edge of the channel, allowing for the navigable area to be maintained.
5. Engineering
| Structural Element | Assessed Condition | Expected lifespan | Recommendations |
| Truncated/capped existing concrete flood wall* | Not possible to determine residual life
without original date of installation, as-built detailed design drawings |
< 20 years | Detailed inspection (including pile thickness measurement) and comparison of existing
foreshore level and prediction of future foreshore levels. |
*where it was not possible to assess the element, conservative assumptions have been made.
Table 3:Table showing individual engineering elements of Barking Creek at A13 Frogmore and their expected lifespan.
Potential engineering improvements / refinements
- Cutting down pre-existing structures to provide toe details presents a risk due to uncertainties/ lack of available information on original date of installation, design details and design assumptions (with respect to issues such as loading and assumed minimum foreshore levels). It is therefore difficult to predict residual life of these vital structural elements.
- Avoid vertical structures, in particular interfaces/corners between vertical structures, which result in wave reflection and localised erosion.
- Establish a suitable monitoring and maintenance regime for the intertidal habitat/ structures/foreshore (monitor foreshore/ nearshore levels to identify any future potential risk of lowering which could result in undermining of the river wall at the toe).
6. Conclusions
6.1 Within the first 2 Years (2006 to 2008):
- In the first 12 months no erosion occurred on the slope and the coir matting and brushwood fascines had not been damaged.
- Cell-grown Common Reed planted on the lower slope largely unsuccessful but subsequently started to colonise naturally. This leads to design advice under the Wildlife, Planting and Greenspace section to allow natural colonisation wherever possible.
- Grassland vegetation establishment from seeding the upper slopes successful despite limited sedimentation.
- Introduced growing medium on the upper slopes considered to have helped establishment.
- Close proximity of a bridge did not prevent the ‘naturalised’ design.
- Greatly improved local visual amenity, with far better relationship to nearby semi-natural habitats.
- Considered very successful in ecological, social and economic terms.
6.2 Within the next 10 Years (2008 to 2018):
- Still considered very successful:
- Sediment accretion and vegetation coverage good. Sediment accretion under bridge still good. Drainage gullies could be indicative of some erosion but are below the footprint of the feature’s footprint.
- Low engineering lifespan of <20 years as a result of unknown information about the truncated concrete wall is unlikely to have impact on the actual structure.
- Litter collection low.
- Main new recommendation: Establish a suitable monitoring and maintenance regime.